
Shopify/dashingArchived
Dashing
Dashing is a Ruby dashboard framework used to build real-time, full-screen data displays. It employs a Ruby domain-specific language for defining data sources and visual components, utilizing a grid-based widget system to organize information for automated visual reporting.
The framework is optimized for television screens and large monitors in office or operations environments. It implements a server-sent events architecture to push live data updates from any source directly to the browser.
The system includes a background job scheduler for periodic data refreshes and automated metric reporting. Client-side rendering is handled by a CoffeeScript runtime within a single-page application shell.
Features
- TV-Optimized Monitoring Displays - Offers a layout engine specifically optimized for full-screen display on televisions and large monitors in office environments.
- Dashboard Frameworks - Provides a complete framework for building real-time, metric-driven visual dashboards.
- Event-Driven Visualizations - Pushes real-time data from various sources to browser widgets using event-driven transport.
- Server-Sent Events - Implements Server-Sent Events to push real-time data updates from the server to the browser.
- Domain Specific Languages - Provides a Ruby DSL for declaring data sources, templates, and update intervals for widgets.
- Real-Time Monitoring Systems - Enables real-time tracking of metrics and system health through automatically updating full-screen displays.
- Dashboard Widgets - Provides a system of modular, self-contained widgets that independently render and refresh real-time data.
- Operations Center Displays - Creates visual dashboards optimized for large monitors and television screens in operations centers.
- TV Display Optimizations - Optimizes real-time data displays for television screens and large monitors in operations environments.
- Grid Layout Engines - Employs a grid-based layout engine to organize data widgets on full-screen displays.
- Widget Engines - Implements a widget engine that organizes self-contained data components on a fixed grid.
- Ruby DSL Dashboard Definitions - Provides a Ruby DSL for declaratively defining dashboard widgets and their associated data sources.
- Ruby Frameworks - Provides a comprehensive Ruby framework for building real-time, full-screen data displays.
- Dashboard Frameworks - Provides a Ruby-centric framework for defining the layout and data sources of information dashboards.
- Visual Metric Reporting - Automates the process of fetching metrics and pushing updates to a visual dashboard.
- Data Refresh Scheduling - Automates the periodic refreshing of dashboard data views to keep metrics up to date.
- Real-Time Message Push - Uses persistent network connections to push real-time data updates from various sources directly to dashboard widgets.
- Background Job Schedulers - Provides a Ruby-based scheduler to trigger periodic data refreshes for dashboard widgets.
- Widget Lifecycle Managers - Manages the instantiation and rendering of dashboard components using a shared client-side message bus.
- Client-Side Runtimes - Implements a CoffeeScript-based runtime in the browser for managing widget state and interactions.
- Single-Page Applications - Utilizes a single-page application shell to maintain a persistent session for seamless full-screen transitions.
- Data Visualization - Framework for building custom operational dashboards.
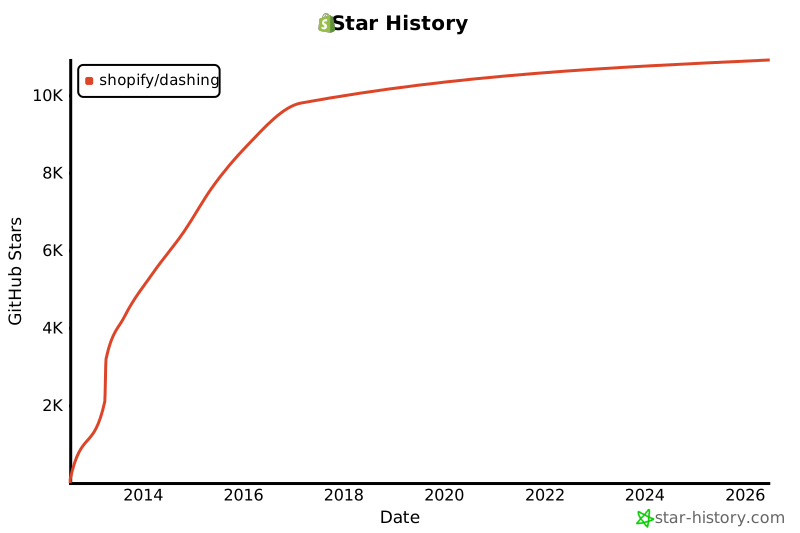
Star history
How this analysis was created: This summary and feature list were written by an AI model that read the project's README and public documentation pages. Each feature links to the documentation it came from; stars, license and language come straight from the GitHub API. The model does not read the source code, and the analysis is refreshed when the project is re-analysed. Learn more on our About page.


